Introduzione all’RNASeq

Introduzione all’analisi RNASeq in R

Dipartimento di Biomedicina e Prevenzione


Marco Chiapello, Revelo Datalab

2023-03-31

The history of sequencing

Key moments for DNA sequencing:

Key moments for DNA sequencing:


Key moments for DNA sequencing:


1953: The structure of the DNA double helix was discovered

James Watson, Francis Crick and Rosalind Franklin

Key moments for DNA sequencing:


1964: Robert Holley, the first person to sequence a tRNA molecule

Robert W. Holley

Key moments for DNA sequencing:


1972: Paul Berg developed the first technology that permitted the isolation of defined DNA fragments

Paul Berg

Key moments for DNA sequencing:


1973: Walter Gilbert published the first nucleotide sequence

Walter Gilbert

Key moments for DNA sequencing:


1973: Walter Gilbert produced ‘DNA sequencing by chemical degradation’.

1973: Frederick Sanger was the first to sequence the complete DNA genome of a bacteriophage, called phi X174

Key moments for DNA sequencing:


1983: DNA amplification technique was developed

Kary Mullis

Key moments for DNA sequencing:


1986: Leroy Hood announced the invention of the first semi-automated DNA sequencing machine

Leroy Hood

Key moments for DNA sequencing:


1987: Applied Biosystems produced the first automated sequencing machine, called ABI370.

Applied Biosystems 370A Prototype Automated DNA Gene Sequencer,

Key moments for DNA sequencing:


1990: The Human Genome Project formally began

Early days: a DNA-sequencing lab in 1994

Key moments for DNA sequencing:


1998: ‘Method of nucleic acid amplification’ was developed

Patent: https://patents.google.com/patent/WO1998044151A1/en

Key moments for DNA sequencing:


2000: A ‘rough draft’ of the human genome was finished by the Human Genome Project

Wadman, M. ‘Rough draft’ of human genome wins researchers’ backing. Nature 393, 399–400 (1998). https://doi.org/10.1038/30790

Key moments for DNA sequencing:


A timeline illustrating the milestones in major genome assembly achievements [Formenti et al., 2020]

History of NGS platforms

First generation NGS

The technology was based on:

  • the chain-termination method

  • the chain-degradation method

Chain-degradation method

Chain-termination method


Chain-termination method


Chain-termination method

Advantages

  1. Gold standard method for accurate detection of single nucleotide variants and small insertions/deletions

  2. Cost effective where single samples need to be tested very urgently

  3. Less reliant on computational tools than NGS

  4. Longer fragments (up to approximately 1000bp) can be sequenced than in short read NGS

Limitations

  1. Limited throughput

  2. Not cost effective for sequencing many genes in parallel

  3. Can require a larger amount of input DNA than NGS

  4. Sanger methods can only sequence short pieces of DNA–about 300 to 1000 base pairs.

  5. The quality of a Sanger sequence is often not very good in the first 15 to 40 bases because that is where the primer binds.

  6. Sequence quality degrades after 700 to 900 bases

First generation NGS


The main advantages of first-generation NGS technologies are:

  • Have a good overall sequence output

  • A high accuracy of 99.99%

  • Preparing nucleic acids of the ideal size is relatively easy

Second generation NGS


Important

Second-generation NGS machines immediately began to drive the ‘genomics revolution’ by massively increased throughput by parallelizing many reactions

Second generation NGS


Second-generation sequencing platforms:

  1. SOLiD: Sequencing by Oligonucleotide Ligation and Detection

  2. 454 GS FLX+: It uses pyrosequencing chemistry

  3. NextSeq 550Dx: Sequence by synthesis

Sequence by Ligation


  • Considered to be one of the most accurate second-generation sequencing technologies

  • it can take up to seven days to complete a single run and its short read length of 35 bp

  • Thermo Fisher Scientific shut down all SOLiD sequencing platforms in 2016

Pyrosequencing


  • Large read lenght generation

  • High reagent cost

  • High error rate for homopolymers

Sequence by synthesis

Sequence by synthesis - History


1997: Evolution of a Novel Approach to Sequencing

Shankar Balasubramanian and David Klenerman

Sequence by synthesis - History


1998: Formation of Solexa

Sequence by synthesis - History


2004: Molecular Clustering Technology Integration

Cluster generation (also known as “bridge amplification”)

Sequence by synthesis - History


2005: phiX-174 Genome Sequencing

2005: Integration of Lynx Therapeutics

2007: Illumina Acquires Solexa

Sequence by synthesis - Process

Third generation NGS


Important

Third-generation methods allow direct sequencing of single DNA molecules

Third generation NGS


Third-generation NGS platforms:

  1. Single-molecule real-time sequencing

  2. Nanopore sequencing

SMRS

Nanopore sequencing

RNASeq pipeline

flowchart TB
  subgraph vitro [In vitro]
    direction TB
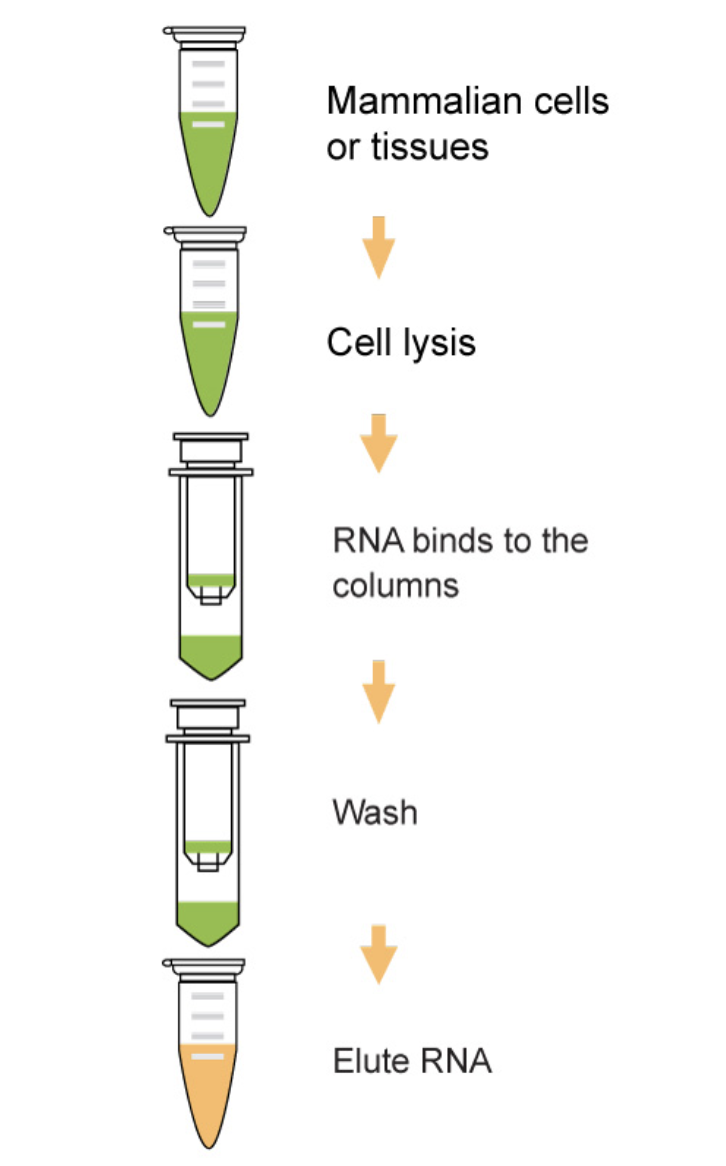
      A(<font size=6>Isolate total RNA) --> B(<font size=6>Enrich a specific type of RNA)
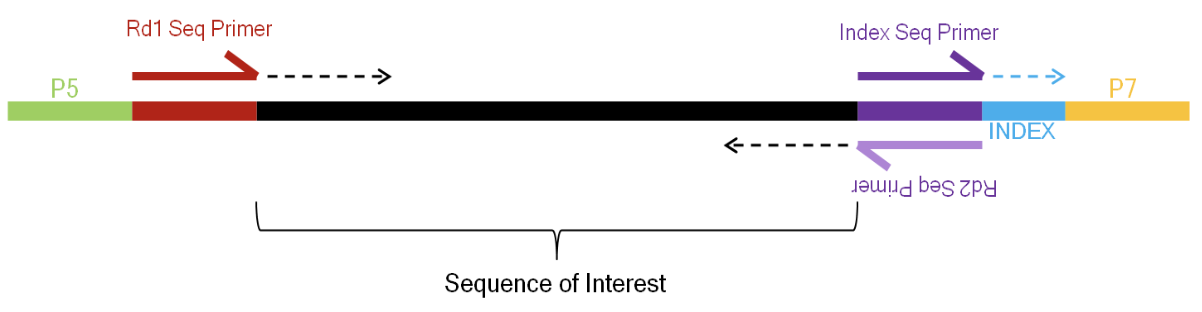
      B --> C(<font size=6>Prepare the RNA sequencing library)
  end
  subgraph silico [In silico]
    direction TB
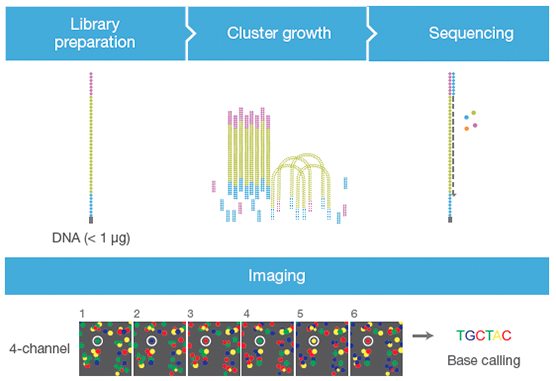
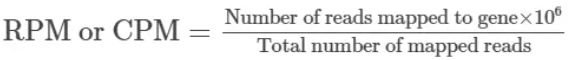
      D(<font size=6>Sequencing) --> E(<font size=6>Quantify expression)
      E --> F(<font size=6>Differential Expression analysis)
      F --> G(<font size=6>Biological conclusions)
  end
  vitro --> silico
  classDef className fill:#D1D1D1,stroke:#333,stroke-width:1px
  class A,B,C,D,E,F,G className;

flowchart TB
  subgraph vitro [In vitro]
    direction TB
      A(<font size=3>Isolate total RNA) --> B(<font size=3>Enrich a specific type of RNA)
      B --> C(<font size=3>Prepare the RNA sequencing library)
  end
  subgraph silico [In silico]
    direction TB
      D(<font size=3>Sequencing) --> E(<font size=3>Quantify expression)
      E --> F(<font size=3>Differential Expression analysis)
      F --> G(<font size=3>Biological conclusions)
  end
  vitro --> silico
  classDef className fill:#D1D1D1,stroke:#333,stroke-width:1px
  classDef classHigh fill:#E3BE34,stroke:#333,stroke-width:4px
  class B,C,D,E,F,G className;
  class A classHigh;
  linkStyle 1 stroke:red

Isolate total RNA

flowchart TB
  subgraph vitro [In vitro]
    direction TB
      A(<font size=3>Isolate total RNA) --> B(<font size=3>Enrich a specific type of RNA)
      B --> C(<font size=3>Prepare the RNA sequencing library)
  end
  subgraph silico [In silico]
    direction TB
      D(<font size=3>Sequencing) --> E(<font size=3>Quantify expression)
      E --> F(<font size=3>Differential Expression analysis)
      F --> G(<font size=3>Biological conclusions)
  end
  vitro --> silico
  classDef className fill:#D1D1D1,stroke:#333,stroke-width:1px
  classDef classHigh fill:#E3BE34,stroke:#333,stroke-width:4px
  class A,B,C,D,E,F,G className;
  linkStyle 0 stroke:red

Quality control

  1. RNA integrity is the major factor affecting the quality of sequencing data

  2. Protocols of RNA-Seq libraries require samples with high-quality RNA

  3. Prior to the construction of the libraries, it is necessary to assess RNA integrity number (RIN)

  4. The RIN measurement is based on a machine learning algorithm

  5. A higher RIN value indicates a higher degree of RNA integrity (range 1–10)

  6. RIN does not directly measure mRNA integrity, which is the main genetic material used in the construction of the libraries

::::

flowchart TB
  subgraph vitro [In vitro]
    direction TB
      A(<font size=3>Isolate total RNA) --> B(<font size=3>Enrich a specific type of RNA)
      B --> C(<font size=3>Prepare the RNA sequencing library)
  end
  subgraph silico [In silico]
    direction TB
      D(<font size=3>Sequencing) --> E(<font size=3>Quantify expression)
      E --> F(<font size=3>Differential Expression analysis)
      F --> G(<font size=3>Biological conclusions)
  end
  vitro --> silico
  classDef className fill:#D1D1D1,stroke:#333,stroke-width:1px
  classDef classHigh fill:#E3BE34,stroke:#333,stroke-width:4px
  class A,C,D,E,F,G className;
  class B classHigh;

Enrich a specific type of RNA

  • mRNA

  • rRNAs and tRNAs (involved in mRNA translation)

  • Small nuclear RNAs (involved in splicing)

  • Small nucleolar RNAs (involved in the modification of rRNAs)

  • microRNA (regulate gene expression at the posttranscriptional level)

  • Long noncoding RNAs (chromatin remodelling, transcriptional control and posttranscriptional processing)

::::

flowchart TB
  subgraph vitro [In vitro]
    direction TB
      A(<font size=3>Isolate total RNA) --> B(<font size=3>Enrich a specific type of RNA)
      B --> C(<font size=3>Prepare the RNA sequencing library)
  end
  subgraph silico [In silico]
    direction TB
      D(<font size=3>Sequencing) --> E(<font size=3>Quantify expression)
      E --> F(<font size=3>Differential Expression analysis)
      F --> G(<font size=3>Biological conclusions)
  end
  vitro --> silico
  classDef className fill:#D1D1D1,stroke:#333,stroke-width:1px
  classDef classHigh fill:#E3BE34,stroke:#333,stroke-width:4px
  class A,C,D,E,F,G className;
  class B classHigh;

Enrich a specific type of RNA


Two options for mRNA enrichment

  • mRNA enrichment – Selectively enriching for poly(A)-tailed transcripts

  • RNA depletion – Selectively depleting abundant/off-target transcripts

::::

flowchart TB
  subgraph vitro [In vitro]
    direction TB
      A(<font size=3>Isolate total RNA) --> B(<font size=3>Enrich a specific type of RNA)
      B --> C(<font size=3>Prepare the RNA sequencing library)
  end
  subgraph silico [In silico]
    direction TB
      D(<font size=3>Sequencing) --> E(<font size=3>Quantify expression)
      E --> F(<font size=3>Differential Expression analysis)
      F --> G(<font size=3>Biological conclusions)
  end
  vitro --> silico
  classDef className fill:#D1D1D1,stroke:#333,stroke-width:1px
  classDef classHigh fill:#E3BE34,stroke:#333,stroke-width:4px
  class A,B,D,E,F,G className;
  class C classHigh;

Prepare the RNA sequencing library


Important

A sequencing library is essentially a pool of RNA fragments with adapters attached

flowchart TB
  subgraph vitro [In vitro]
    direction TB
      A(<font size=3>Isolate total RNA) --> B(<font size=3>Enrich a specific type of RNA)
      B --> C(<font size=3>Prepare the RNA sequencing library)
  end
  subgraph silico [In silico]
    direction TB
      D(<font size=3>Sequencing) --> E(<font size=3>Quantify expression)
      E --> F(<font size=3>Differential Expression analysis)
      F --> G(<font size=3>Biological conclusions)
  end
  vitro --> silico
  classDef className fill:#D1D1D1,stroke:#333,stroke-width:1px
  classDef classHigh fill:#E3BE34,stroke:#333,stroke-width:4px
  class A,B,D,E,F,G className;
  class C classHigh;

Prepare the RNA sequencing library Step 1


Fragmentation

  1. Breaking of RNA strands into pieces

flowchart TB
  subgraph vitro [In vitro]
    direction TB
      A(<font size=3>Isolate total RNA) --> B(<font size=3>Enrich a specific type of RNA)
      B --> C(<font size=3>Prepare the RNA sequencing library)
  end
  subgraph silico [In silico]
    direction TB
      D(<font size=3>Sequencing) --> E(<font size=3>Quantify expression)
      E --> F(<font size=3>Differential Expression analysis)
      F --> G(<font size=3>Biological conclusions)
  end
  vitro --> silico
  classDef className fill:#D1D1D1,stroke:#333,stroke-width:1px
  classDef classHigh fill:#E3BE34,stroke:#333,stroke-width:4px
  class A,B,D,E,F,G className;
  class C classHigh;

Prepare the RNA sequencing library Step 2


Attachment of adapters

  1. Adapters are a short, chemically-synthesised oligonucleotide that can be attached to the ends of DNA molecules

  2. Act as barcodes to identify where each nucleotide was originally located

flowchart TB
  subgraph vitro [In vitro]
    direction TB
      A(<font size=3>Isolate total RNA) --> B(<font size=3>Enrich a specific type of RNA)
      B --> C(<font size=3>Prepare the RNA sequencing library)
  end
  subgraph silico [In silico]
    direction TB
      D(<font size=3>Sequencing) --> E(<font size=3>Quantify expression)
      E --> F(<font size=3>Differential Expression analysis)
      F --> G(<font size=3>Biological conclusions)
  end
  vitro --> silico
  classDef className fill:#D1D1D1,stroke:#333,stroke-width:1px
  classDef classHigh fill:#E3BE34,stroke:#333,stroke-width:4px
  class A,B,D,E,F,G className;
  class C classHigh;

Prepare the RNA sequencing library Step 3


Library quantification

Important

This is key to obtaining high quality NGS data

  1. It provides the number of nucleic acids ready to be sequenced in a sample

  2. It is important to try and obtain the highest complexity level as possible in an NGS library

  3. Variety of techniques: UV absorption, intercalating dyes, hydrolysis probes and droplet digital emulsion PCR

flowchart TB
  subgraph vitro [In vitro]
    direction TB
      A(<font size=3>Isolate total RNA) --> B(<font size=3>Enrich a specific type of RNA)
      B --> C(<font size=3>Prepare the RNA sequencing library)
  end
  subgraph silico [In silico]
    direction TB
      D(<font size=3>Sequencing) --> E(<font size=3>Quantify expression)
      E --> F(<font size=3>Differential Expression analysis)
      F --> G(<font size=3>Biological conclusions)
  end
  vitro --> silico
  classDef className fill:#D1D1D1,stroke:#333,stroke-width:1px
  classDef classHigh fill:#E3BE34,stroke:#333,stroke-width:4px
  class A,B,C,E,F,G className;
  class D classHigh;

Sequencing Step 1


BCL to FASTQ conversion

  1. Illumina sequencing technology uses cluster generation and sequencing by synthesis chemistry to sequence millions or billions of clusters on a flow cell

  2. During sequencing, for each cluster, base calls are made and stored in the form of individual base call (or BCL) files

  3. When sequencing completes, the base calls in the BCL files must be converted into sequence data

flowchart TB
  subgraph vitro [In vitro]
    direction TB
      A(<font size=3>Isolate total RNA) --> B(<font size=3>Enrich a specific type of RNA)
      B --> C(<font size=3>Prepare the RNA sequencing library)
  end
  subgraph silico [In silico]
    direction TB
      D(<font size=3>Sequencing) --> E(<font size=3>Quantify expression)
      E --> F(<font size=3>Differential Expression analysis)
      F --> G(<font size=3>Biological conclusions)
  end
  vitro --> silico
  classDef className fill:#D1D1D1,stroke:#333,stroke-width:1px
  classDef classHigh fill:#E3BE34,stroke:#333,stroke-width:4px
  class A,B,C,E,F,G className;
  class D classHigh;

Sequencing Step 1


BCL to FASTQ conversion


flowchart TB
  subgraph vitro [In vitro]
    direction TB
      A(<font size=3>Isolate total RNA) --> B(<font size=3>Enrich a specific type of RNA)
      B --> C(<font size=3>Prepare the RNA sequencing library)
  end
  subgraph silico [In silico]
    direction TB
      D(<font size=3>Sequencing) --> E(<font size=3>Quantify expression)
      E --> F(<font size=3>Differential Expression analysis)
      F --> G(<font size=3>Biological conclusions)
  end
  vitro --> silico
  classDef className fill:#D1D1D1,stroke:#333,stroke-width:1px
  classDef classHigh fill:#E3BE34,stroke:#333,stroke-width:4px
  class A,B,C,E,F,G className;
  class D classHigh;

Sequencing Step 2


Pre-process


  1. Assess the quality of sequencing data

  2. Demultiplex by index or barcode

  3. Remove adapter sequences

  4. Trim reads by quality

  5. Discard reads by quality/ambiguity

flowchart TB
  subgraph vitro [In vitro]
    direction TB
      A(<font size=3>Isolate total RNA) --> B(<font size=3>Enrich a specific type of RNA)
      B --> C(<font size=3>Prepare the RNA sequencing library)
  end
  subgraph silico [In silico]
    direction TB
      D(<font size=3>Sequencing) --> E(<font size=3>Quantify expression)
      E --> F(<font size=3>Differential Expression analysis)
      F --> G(<font size=3>Biological conclusions)
  end
  vitro --> silico
  classDef className fill:#D1D1D1,stroke:#333,stroke-width:1px
  classDef classHigh fill:#E3BE34,stroke:#333,stroke-width:4px
  class A,B,C,E,F,G className;
  class D classHigh;

Sequencing Step 3


Read mapping


  1. Mapping reads to a reference genome or transcriptome

  2. We need to retrieve a reference genome or transcriptome

    • Download from public databases

    • Create De Novo

flowchart TB
  subgraph vitro [In vitro]
    direction TB
      A(<font size=3>Isolate total RNA) --> B(<font size=3>Enrich a specific type of RNA)
      B --> C(<font size=3>Prepare the RNA sequencing library)
  end
  subgraph silico [In silico]
    direction TB
      D(<font size=3>Sequencing) --> E(<font size=3>Quantify expression)
      E --> F(<font size=3>Differential Expression analysis)
      F --> G(<font size=3>Biological conclusions)
  end
  vitro --> silico
  classDef className fill:#D1D1D1,stroke:#333,stroke-width:1px
  classDef classHigh fill:#E3BE34,stroke:#333,stroke-width:4px
  class A,B,C,E,F,G className;
  class D classHigh;

Sequencing Step 4


Read mapping


  1. Fast (splice-unaware) aligners to a reference transcriptome

  2. Splice-aware aligners to a reference genome

  3. Quasi-mappers (alignment-free mappers) to a reference transcriptome

flowchart TB
  subgraph vitro [In vitro]
    direction TB
      A(<font size=3>Isolate total RNA) --> B(<font size=3>Enrich a specific type of RNA)
      B --> C(<font size=3>Prepare the RNA sequencing library)
  end
  subgraph silico [In silico]
    direction TB
      D(<font size=3>Sequencing) --> E(<font size=3>Quantify expression)
      E --> F(<font size=3>Differential Expression analysis)
      F --> G(<font size=3>Biological conclusions)
  end
  vitro --> silico
  classDef className fill:#D1D1D1,stroke:#333,stroke-width:1px
  classDef classHigh fill:#E3BE34,stroke:#333,stroke-width:4px
  class A,B,C,D,F,G className;
  class E classHigh;

Quantify expression


Normalized expression units


  1. Normalized gene expression units provide consistent and comparable measures to compare and visualize gene expression counts within and across samples

  2. Normalized gene expression units are necessary to remove technical biases

flowchart TB
  subgraph vitro [In vitro]
    direction TB
      A(<font size=3>Isolate total RNA) --> B(<font size=3>Enrich a specific type of RNA)
      B --> C(<font size=3>Prepare the RNA sequencing library)
  end
  subgraph silico [In silico]
    direction TB
      D(<font size=3>Sequencing) --> E(<font size=3>Quantify expression)
      E --> F(<font size=3>Differential Expression analysis)
      F --> G(<font size=3>Biological conclusions)
  end
  vitro --> silico
  classDef className fill:#D1D1D1,stroke:#333,stroke-width:1px
  classDef classHigh fill:#E3BE34,stroke:#333,stroke-width:4px
  class A,B,C,D,F,G className;
  class E classHigh;

Quantify expression Normalized expression units


Reads per million


Definition

RPM (also known as CPM) is a basic gene expression unit that normalizes only for sequencing depth (depth-normalized counts)


flowchart TB
  subgraph vitro [In vitro]
    direction TB
      A(<font size=3>Isolate total RNA) --> B(<font size=3>Enrich a specific type of RNA)
      B --> C(<font size=3>Prepare the RNA sequencing library)
  end
  subgraph silico [In silico]
    direction TB
      D(<font size=3>Sequencing) --> E(<font size=3>Quantify expression)
      E --> F(<font size=3>Differential Expression analysis)
      F --> G(<font size=3>Biological conclusions)
  end
  vitro --> silico
  classDef className fill:#D1D1D1,stroke:#333,stroke-width:1px
  classDef classHigh fill:#E3BE34,stroke:#333,stroke-width:4px
  class A,B,C,D,F,G className;
  class E classHigh;

Quantify expression Normalized expression units


Reads per kilo base of transcript per million mapped reads


Definition

RPKM is normalized to correct the gene (transcript) lengths and library sizes (sequencing depth)


flowchart TB
  subgraph vitro [In vitro]
    direction TB
      A(<font size=3>Isolate total RNA) --> B(<font size=3>Enrich a specific type of RNA)
      B --> C(<font size=3>Prepare the RNA sequencing library)
  end
  subgraph silico [In silico]
    direction TB
      D(<font size=3>Sequencing) --> E(<font size=3>Quantify expression)
      E --> F(<font size=3>Differential Expression analysis)
      F --> G(<font size=3>Biological conclusions)
  end
  vitro --> silico
  classDef className fill:#D1D1D1,stroke:#333,stroke-width:1px
  classDef classHigh fill:#E3BE34,stroke:#333,stroke-width:4px
  class A,B,C,D,F,G className;
  class E classHigh;

Quantify expression Normalized expression units


Transcripts per million


Definition

TPM is a measurement of the proportion of transcripts in your pool of RNA


flowchart TB
  subgraph vitro [In vitro]
    direction TB
      A(<font size=3>Isolate total RNA) --> B(<font size=3>Enrich a specific type of RNA)
      B --> C(<font size=3>Prepare the RNA sequencing library)
  end
  subgraph silico [In silico]
    direction TB
      D(<font size=3>Sequencing) --> E(<font size=3>Quantify expression)
      E --> F(<font size=3>Differential Expression analysis)
      F --> G(<font size=3>Biological conclusions)
  end
  vitro --> silico
  classDef className fill:#D1D1D1,stroke:#333,stroke-width:1px
  classDef classHigh fill:#E3BE34,stroke:#333,stroke-width:4px
  class A,B,C,D,E,G className;
  class F classHigh;

Differentially expression analysis


Important

  • A basic task in the analysis of count data from RNA-seq is the detection of differentially expressed genes.

  • It determines genotypical differences between two or more conditions of cells, in support of specific hypothesis-driven studies.

  • The integration and the visualized representation of DGE result analysis functions can facilitate the downstream studies.

flowchart TB
  subgraph vitro [In vitro]
    direction TB
      A(<font size=3>Isolate total RNA) --> B(<font size=3>Enrich a specific type of RNA)
      B --> C(<font size=3>Prepare the RNA sequencing library)
  end
  subgraph silico [In silico]
    direction TB
      D(<font size=3>Sequencing) --> E(<font size=3>Quantify expression)
      E --> F(<font size=3>Differential Expression analysis)
      F --> G(<font size=3>Biological conclusions)
  end
  vitro --> silico
  classDef className fill:#D1D1D1,stroke:#333,stroke-width:1px
  classDef classHigh fill:#E3BE34,stroke:#333,stroke-width:4px
  class A,B,C,D,E,F className;
  class G classHigh;

Biological conclusion

How many samples do I need?

Power analysis

Power analysis

  • Type I error: controlled by the α value. Often set to 0.01 (1%) or 0.001 (0.1%) in RNA-seq experiments.

Power analysis

  • Type I error: controlled by the α value. Often set to 0.01 (1%) or 0.001 (0.1%) in RNA-seq experiments.

  • Type II error: controlled by the β value. (1−β) will give you the power of your analysis. Should be set to 70 or 80% to detect 70 or 80% of the differentially expressed genes. The number of biological replicates might be hard to reach in practice for RNA-seq experiments.

  • Effect size: this is a parameter you will set. For instance, if you want to investigate genes that differ between treatments with a difference of their mean of 2 then the effect size is equal to 2.

  • Sample size: the quantity you want to calculate.

Let’s say we want:

  • Type I error of 5%. (α=0.05)
  • Type II error of 0.2. (Power=1−β=0.8)
  • Effect size of 2. (d=2)
library("pwr")

pwr.t.test(d = 2,
           power = .8,
           sig.level = .05,
           type = "two.sample",
           alternative = "two.sided")

     Two-sample t test power calculation 

              n = 5.089995
              d = 2
      sig.level = 0.05
          power = 0.8
    alternative = two.sided

NOTE: n is number in *each* group

Let’s say we want:

  • Effect size of 1. (d=1)
library("pwr")

pwr.t.test(d = 1,
           power = .8,
           sig.level = .05,
           type = "two.sample",
           alternative = "two.sided")

     Two-sample t test power calculation 

              n = 16.71472
              d = 1
      sig.level = 0.05
          power = 0.8
    alternative = two.sided

NOTE: n is number in *each* group

Power analysis for RNA-seq

General Considerations


RNA-seq experiments often suffer from a low statistical power

General Considerations


RNA-seq experiments often suffer from a low statistical power


Low power can lead to a lack of reproducibility of the research findings

General Considerations


RNA-seq experiments often suffer from a low statistical power


Low power can lead to a lack of reproducibility of the research findings


The number of replicates is one of the critical parameter related to the power of an analysis

Replicates

Klaus B., EMBO J (2015) 34: 2727-2730

Do we need technical replicates?

No

No

Important

With the current RNA-Seq technologies, technical variation is much lower than biological variation andtechnical replicates are unneccessary

Do we need biological replicates?

YES

YES

Important

Biological replicates are absolutely essential for differential expression analysis

YES

Important

For differential expression analysis, the more biological replicates, the better the estimates of biological variation and the more precise our estimates of the mean expression levels

Biological replicates are of greater importance than sequencing depth

Liu, Y., et al., Bioinformatics (2014) 30(3): 301–304

Replicates are almost always preferred to greater sequencing depth for bulk RNA-Seq


Important

However, guidelines depend on the experiment performed and the desired analysis.

Here some examples:

General gene-level differential expression
- ENCODE guidelines suggest 30 million SE reads per sample (stranded).
- 15 million reads per sample is often sufficient, if there are a good number of replicates (>3).
- Spend money on more biological replicates, if possible.
- Generally recommended to have read length >= 50 bp

Replicates are almost always preferred to greater sequencing depth for bulk RNA-Seq


Important

However, guidelines depend on the experiment performed and the desired analysis.

Here some examples:

Gene-level differential expression with detection of lowly-expressed genes
- Similarly benefits from replicates more than sequencing depth.
- Sequence deeper with at least 30-60 million reads depending on level of expression (start with 30 million with a good number of replicates). - Generally recommended to have read length >= 50 bp

Replicates are almost always preferred to greater sequencing depth for bulk RNA-Seq


Important

However, guidelines depend on the experiment performed and the desired analysis.

Here some examples:

Isoform-level differential expression
- Of known isoforms, suggested to have a depth of at least 30 million reads per sample and paired-end reads.
- Of novel isoforms should have more depth (> 60 million reads per sample).
- Choose biological replicates over paired/deeper sequencing.
- Generally recommended to have read length >= 50 bp, but longer is better as the reads will be more likely to cross exon junctions
- Perform careful QC of RNA quality. Be careful to use high quality preparation methods and restrict analysis to high quality RIN # samples.

Principles of a good experimental design

Randomization

This should remove undesired and sometimes unknown bias coming from an unidentified source of variation (e.g. different temperatures in the same greehouse).

Replication

By repeating the same minimal experiment more than once, you can estimate the error due to the experimenter manipulation and your treatment effect.

Blocking

Can help to reduce variability unexplained in one’s model. If your group consist of male and female individual, there is a chance that they will not respond in the same way to a given treatment. Therefore, “sex” should be a blocking factor in this case.

Applications

Diagnostics and disease profiling


  1. Transcriptional start sites

  2. Uncovered alternative promoter usage

  3. Novel splicing alterations

Human and pathogen transcriptomes


  1. Quantifying gene expression changes

  2. Identifying novel virulence factors

  3. Predicting antibiotic resistance

  4. Unveiling host-pathogen immune interactions

Responses to environment


  1. Transcriptomics allows for the identification of genes and pathways that respond to biotic and abiotic environmental stresses

  2. The nontargeted nature of transcriptomics allows for the identification of novel transcriptional networks in complex systems

  3. RNA-virus identification for pathogen containment

Gene function annotation

  1. All transcriptomic techniques have been particularly useful in identifying the functions of genes and identifying those responsible for particular phenotypes

  2. Assembly of RNA-Seq reads is not dependent on a reference genome, and it is so ideal for gene expression studies of nonmodel organisms

  3. RNA-Seq can also be used to identify previously unknown protein coding regions in existing sequenced genomes

Noncoding RNA


  1. RNASeq is applicable to noncoding RNAs that are not translated into a protein, but instead, have direct functions

  2. Many of these noncoding RNAs affect disease states, including cancer, cardiovascular, and neurological diseases

Domande?