Before we start
Data Carpentry contributors
Learning Objectives
After completing this module, the learner should be able to:
- Describe the purpose of the RStudio script, console, environment, and plot windows.
- Organize files and directories for a set of analysis in an R Project.
- Define the following terms as they relate to R: script, function, working directory, assign, object, variable.
- Assign values to variables.
- Call functions with zero or more named or unnamed arguments.
- Use the built-in RStudio help interface to search for more information on R functions.
- Demonstrate how to provide sufficient information for troubleshooting with the R user community.
Before we get started
It is good practice to keep a set of related data, analyses, and text self-contained in a single folder, called the working directory. All of the scripts within this folder can then use relative paths to files that indicate where inside the project a file is located (as opposed to absolute paths, which point to where a file is on a specific computer). Working this way makes it a lot easier to move your project around on your computer and share it with others without worrying about whether or not the underlying scripts will still work.
RStudio provides a helpful set of tools to do this through its “Projects” interface, which not only creates a working directory for you but also remembers its location (allowing you to quickly navigate to it) and optionally preserves custom settings and open files to make it easier to resume work after a break. Below, we will go through the steps for creating an RProject for this tutorial.
- Start RStudio (presentation of RStudio -below- should happen here)
- Under the
Filemenu, click onNew project, chooseNew directory, thenEmpty project - Enter a name for this new folder (or “directory”, in computer science), and choose a convenient location for it. This will be your working directory for the rest of the day (e.g.,
~/data-carpentry) - Click on “Create project”
- Under the
Filestab on the right of the screen, click onNew Folderand create a folder nameddatawithin your newly created working directory. (e.g.,~/data-carpentry/data) - Create a new R script (File > New File > R script) and save it in your working directory (e.g.
data-carpentry-script.R)
Your working directory should now look like this:
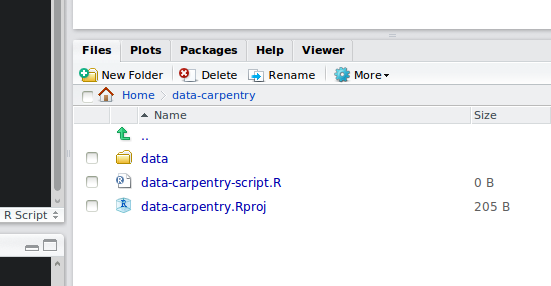
How it should look like at the beginning of this lesson
Organizing your working directory
Using a consistent folder structure across your projects will help keep things organized, and will also make it easy find/file things in the future. This can be especially helpful when you have multiple projects. In general, you may create directories (folders) for scripts, data, and documents.
data/Use this folder to store your raw data and intermediate datasets you may create for the need of a particular analysis. For the sake of transparency and provenance, you should always keep a copy of your raw data accessible and do as much of your data cleanup and preprocessing programmatically (i.e. with scripts, rather than manually) as possible. Separating raw data from processed data is also a good idea. For example, you could have filesdata/raw/tree_survey.plot1.txtand...plot2.txtkept separate from adata/processed/tree.survey.csvfile generated by thescripts/01.preprocess.tree_survey.Rscript.documents/This would be a place to keep outlines, drafts, and other text.scripts/This would be the location to keep your R scripts for different analyses or plotting, and potentially a separate folder for your functions (more on that later).
You may want additional directories or subdirectories depending on your project needs, but these should form the backbone of your working directory. For this workshop, you only need a data/ folder.
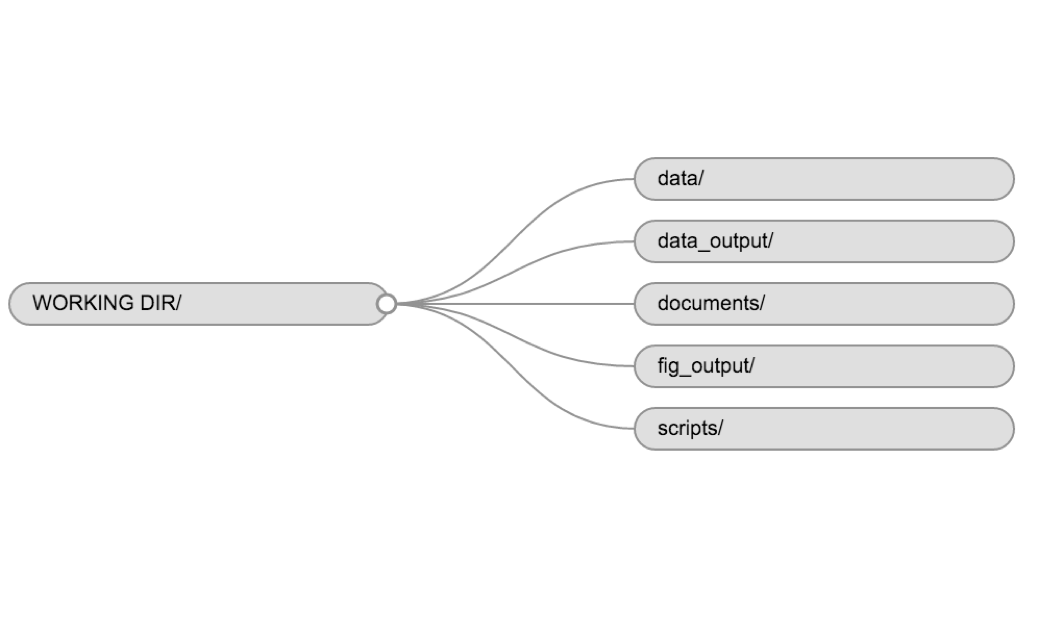
Example of a working directory structure
Presentation of RStudio
Let’s start by learning about RStudio, the Integrated Development Environment (IDE).
The RStudio IDE open source product is free under the Affero General Public License (AGPL) v3. RStudio IDE is also available with a commercial license and priority email support from RStudio, Inc.
We will use RStudio IDE to write code, navigate the files found on our computer, inspect the variables we are going to create, and visualize the plots we will generate. RStudio can also be used for other things (e.g., version control, developing packages, writting Shiny apps) that we will not cover during the workshop.
RStudio is divided into 4 “Panes”: the editor for your scripts and documents (top-left, in the default layout), the R console (bottom-left), your environment/history (top-right), and your files/plots/packages/help/viewer (bottom-right). The placement of these panes and their content can be customized (see menu, RStudio -> Preferences -> Pane Layout). One of the advantages of using RStudio is that all the information you need to write code is available in a single window. Additionally, with many shortcuts, autocompletion, and highlighting for the major file types you use while developing in R, RStudio will make typing easier and less error-prone.
Interacting with R
The basis of programming is that we write down instructions for the computer to follow, and then we tell the computer to follow those instructions. We write, or code, instructions in R because it is a common language that both the computer and we can understand. We call the instructions commands and we tell the computer to follow the instructions by executing (also called running) those commands.
There are two main ways of interacting with R: using the console or by using script files (plain text files that contain your code). We want our code and workflow to be reproducible. In other words, we want to write code in a way that anyone can easily replicate our results on their computer.
The console pane (in RStudio, the bottom left panel) is the place where R is waiting for you to tell it what to do, and where it will show the results of a command that has been executed. You can type commands directly into the console and press Enter to execute those commands, but they will be forgotten when you close the session. It is better to enter the commands in the script editor, and save the script. This way, you have a complete record of what you did, you can easily show others how you did it and you can do it again later on if needed. RStudio allows you to execute commands directly from the script editor by using the Ctrl + Enter shortcut. The command on the current line in the script or all of the commands in the currently selected text will be sent to the console and executed when you press Ctrl + Enter.
At some point in your analysis you may want to check the content of a variable or the structure of an object, without necessarily keeping a record of it in your script. You can type these commands and execute them directly in the console. RStudio provides the Ctrl + 1 and Ctrl + 2 shortcuts allow you to jump between the script and the console windows.
If R is ready to accept commands, the R console shows a > prompt. If it receives a command (by typing, copy-pasting or sent from the script editor using Ctrl + Enter), R will try to execute it, and when ready, will show the results and come back with a new >-prompt to wait for new commands.
If R is still waiting for you to enter more data because it isn’t complete yet, the console will show a + prompt. It means that you haven’t finished entering a complete command. This is because you have not ‘closed’ a parenthesis or quotation, i.e. you don’t have the same number of left-parentheses as right-parentheses, or the same number of opening and closing quotation marks. If you’re in RStudio and this happens, click inside the console window and press Esc; this will cancel the incomplete command and return you to the > prompt.
Basics of R
R is a versatile, open source programming/scripting language inspired by the programming language S, which is useful both for statistics and data science.
- Free/Libre/Open Source Software under the GPL version 2.
- Superior (if not just comparable) to commercial alternatives. R has over 7,000 user contributed packages at this time. It’s widely used both in academia and industry.
- Available on all platforms.
- Not just for statistics, but also general purpose programming.
- For people who have experience in programmming: R is both an object-oriented and a so-called functional language.
- Large and growing community of peers.
The R syntax
Start by showing an example of a script
- Point to the different parts:
- a function
- the assignment operator
<- - the
=for arguments - the comments
#and how they are used to document function and its content - the
$operator - Point to indentation and consistency in spacing to improve clarity
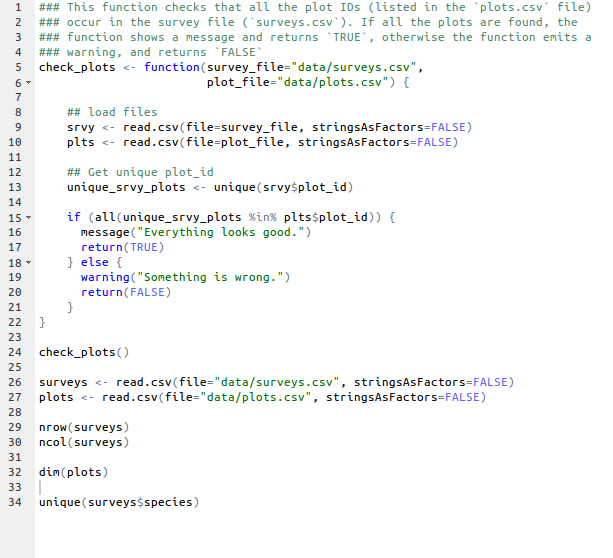
Example of a simple R script
Commenting
Use # signs to comment. Anything to the right of a # is ignored by R, meaning it won’t be executed. Comments are a great way to describe what your code does within the code itself, so comment liberally in your R scripts.
Assignment operator
<- is the assignment operator. It assigns values on the right to objects on the left. So, after executing x <- 3, the value of x is 3. The arrow can be read as 3 goes into x. For historical reasons, you can also use = for assignments, but not in every context. Because of the slight differences in syntax, it is good practice to use always <- for assignments, except when specifying the values of arguments in functions, when only = should be used, see below.
In RStudio, typing Alt + - (push Alt at the same time as the - key) will write <- in a single keystroke.
Functions and their arguments
Functions are “canned scripts” that automate something complicated or convenient or both. Many functions are predefined, or can be made available by importing R packages (more on that later). A function usually gets one or more inputs called arguments. Functions often (but not always) return a value. A typical example would be the function sqrt(). The input (the argument) must be a number, and the return value (in fact, the output) is the square root of that number. Executing a function (‘running it’) is called calling the function. An example of a function call is:
b <- sqrt(a)
Here, the value of a is given to the sqrt() function, the sqrt() function calculates the square root, and returns the value which is then assigned to variable b. This function is very simple, because it takes just one argument.
The return ‘value’ of a function need not be numerical (like that of sqrt()), and it also does not need to be a single item: it can be a set of things, or even a data set. We’ll see that when we read data files into R.
Arguments can be anything, not only numbers or filenames, but also other objects. Exactly what each argument means differs per function, and must be looked up in the documentation (see below). Some functions take arguments which may either be specified by the user, or if left out, take on a default value: these are called options. Options are typically used to alter the way the function operates, such as whether it ignores ‘bad values’, or what symbol to use in a plot. However, if you want something specific, you can specify a value of your choice which will be used instead of the default.
Let’s try a function that can take multiple arguments: round().
round(3.14159)## [1] 3Here, we’ve called round() with just one argument, 3.14159, and it has returned the value 3. That’s because the default is to round to the nearest whole number. If we want more digits we can see how to do that by getting information about the round function. We can use args(round) or look at the help for this function using ?round.
args(round)## function (x, digits = 0)
## NULL?roundWe see that if we want a different number of digits, we can type digits=2 or however many we want.
round(3.14159, digits=2)## [1] 3.14If you provide the arguments in the exact same order as they are defined you don’t have to name them:
round(3.14159, 2)## [1] 3.14And if you do name the arguments, you can switch their order:
round(digits=2, x=3.14159)## [1] 3.14It’s good practice to put the non-optional arguments (like the number you’re rounding) first in your function call, and to specify the names of all optional arguments. If you don’t, someone reading your code might have to look up the definition of a function with unfamiliar arguments to understand what you’re doing.
Seeking help
I know the name of the function I want to use, but I’m not sure how to use it
If you need help with a specific function, let’s say barplot(), you can type:
?barplotIf you just need to remind yourself of the names of the arguments, you can use:
args(lm)I want to use a function that does X, there must be a function for it but I don’t know which one…
If you are looking for a function to do a particular task, you can use help.search() function, which is called by the double question mark ??. However, this only looks through the installed packages for help pages with a match to your search request
??kruskalIf you can’t find what you are looking for, you can use the rdocumention.org website that searches through the help files across all packages available.
I am stuck… I get an error message that I don’t understand
Start by googling the error message. However, this doesn’t always work very well because often, package developers rely on the error catching provided by R. You end up with general error messages that might not be very helpful to diagnose a problem (e.g. “subscript out of bounds”). If the message is very generic, you might also include the name of the function or package you’re using in your query.
However, you should check Stack Overflow. Search using the [r] tag. Most questions have already been answered, but the challenge is to use the right words in the search to find the answers: http://stackoverflow.com/questions/tagged/r
The Introduction to R can also be dense for people with little programming experience but it is a good place to understand the underpinnings of the R language.
The R FAQ is dense and technical but it is full of useful information.
Asking for help
The key to get help from someone is for them to grasp your problem rapidly. You should make it as easy as possible to pinpoint where the issue might be.
Try to use the correct words to describe your problem. For instance, a package is not the same thing as a library. Most people will understand what you meant, but others have really strong feelings about the difference in meaning. The key point is that it can make things confusing for people trying to help you. Be as precise as possible when describing your problem.
If possible, try to reduce what doesn’t work to a simple reproducible example. If you can reproduce the problem using a very small data.frame instead of your 50,000 rows and 10,000 columns one, provide the small one with the description of your problem. When appropriate, try to generalize what you are doing so even people who are not in your field can understand the question. For instance instead of using a subset of your real dataset, create a small (3 columns, 5 row) generic one. For more information on how to write a reproducible example see this article by Hadley Wickham.
To share an object with someone else, if it’s relatively small, you can use the function dput(). It will output R code that can be used to recreate the exact same object as the one in memory:
dput(head(iris)) # iris is an example data.frame that comes with R## structure(list(Sepal.Length = c(5.1, 4.9, 4.7, 4.6, 5, 5.4),
## Sepal.Width = c(3.5, 3, 3.2, 3.1, 3.6, 3.9), Petal.Length = c(1.4,
## ...If the object is larger, provide either the raw file (i.e., your CSV file) with your script up to the point of the error (and after removing everything that is not relevant to your issue). Alternatively, in particular if your questions is not related to a data.frame, you can save any R object to a file:
saveRDS(iris, file="/tmp/iris.rds")The content of this file is however not human readable and cannot be posted directly on Stack Overflow. It can however be sent to someone by email who can read it with this command:
some_data <- readRDS(file="~/Downloads/iris.rds")Last, but certainly not least, always include the output of sessionInfo() as it provides critical information about your platform, the versions of R and the packages that you are using, and other information that can be very helpful to understand your problem.
sessionInfo()## R version 3.3.2 (2016-10-31)
## Platform: x86_64-pc-linux-gnu (64-bit)
## Running under: Ubuntu 16.10
##
## locale:
## [1] LC_CTYPE=en_US.UTF-8 LC_NUMERIC=C
## [3] LC_TIME=en_US.utf8 LC_COLLATE=en_US.UTF-8
## [5] LC_MONETARY=en_US.utf8 LC_MESSAGES=en_US.UTF-8
## [7] LC_PAPER=en_US.utf8 LC_NAME=C
## [9] LC_ADDRESS=C LC_TELEPHONE=C
## [11] LC_MEASUREMENT=en_US.utf8 LC_IDENTIFICATION=C
##
## attached base packages:
## [1] stats graphics grDevices utils datasets base
##
## other attached packages:
## [1] BiocInstaller_1.24.0
##
## loaded via a namespace (and not attached):
## [1] backports_1.0.4 magrittr_1.5 rprojroot_1.1 tools_3.3.2
## [5] htmltools_0.3.5 yaml_2.1.14 Rcpp_0.12.8 stringi_1.1.2
## [9] rmarkdown_1.2 knitr_1.15.1 methods_3.3.2 stringr_1.1.0
## [13] digest_0.6.10 evaluate_0.10Where to ask for help?
- Your friendly colleagues: if you know someone with more experience than you, they might be able and willing to help you.
- Stack Overflow: if your question hasn’t been answered before and is well crafted, chances are you will get an answer in less than 5 min. Remember to follow their guidelines on how to ask a good question.
- The R-help mailing list: it is read by a lot of people (including most of the R core team), a lot of people post to it, but the tone can be pretty dry, and it is not always very welcoming to new users. If your question is valid, you are likely to get an answer very fast but don’t expect that it will come with smiley faces. Also, here more than everywhere else, be sure to use correct vocabulary (otherwise you might get an answer pointing to the misuse of your words rather than answering your question). You will also have more success if your question is about a base function rather than a specific package.
- If your question is about a specific package, see if there is a mailing list for it. Usually it’s included in the DESCRIPTION file of the package that can be accessed using
packageDescription("name-of-package"). You may also want to try to email the author of the package directly, or open an issue on the code repository (e.g., GitHub). - There are also some topic-specific mailing lists (GIS, phylogenetics, etc…), the complete list is here.
More resources
- The Posting Guide for the R mailing lists.
- How to ask for R help useful guidelines
- This blog post by Jon Skeet has quite comprehensive advice on how to ask programming questions.
Data Carpentry, 2016. License. Questions? Feedback? Please file an issue on GitHub.